

Drag-and-drop dashboard builder
Create polished, interactive dashboards in a visual workspace. Arrange charts, scorecards, tables, filters, and drill-down views without relying on code or lengthy development cycles.
CuLyze is an enterprise business intelligence platform that helps teams create interactive dashboards, blend data across sources, and deliver executive-ready insights without writing code.
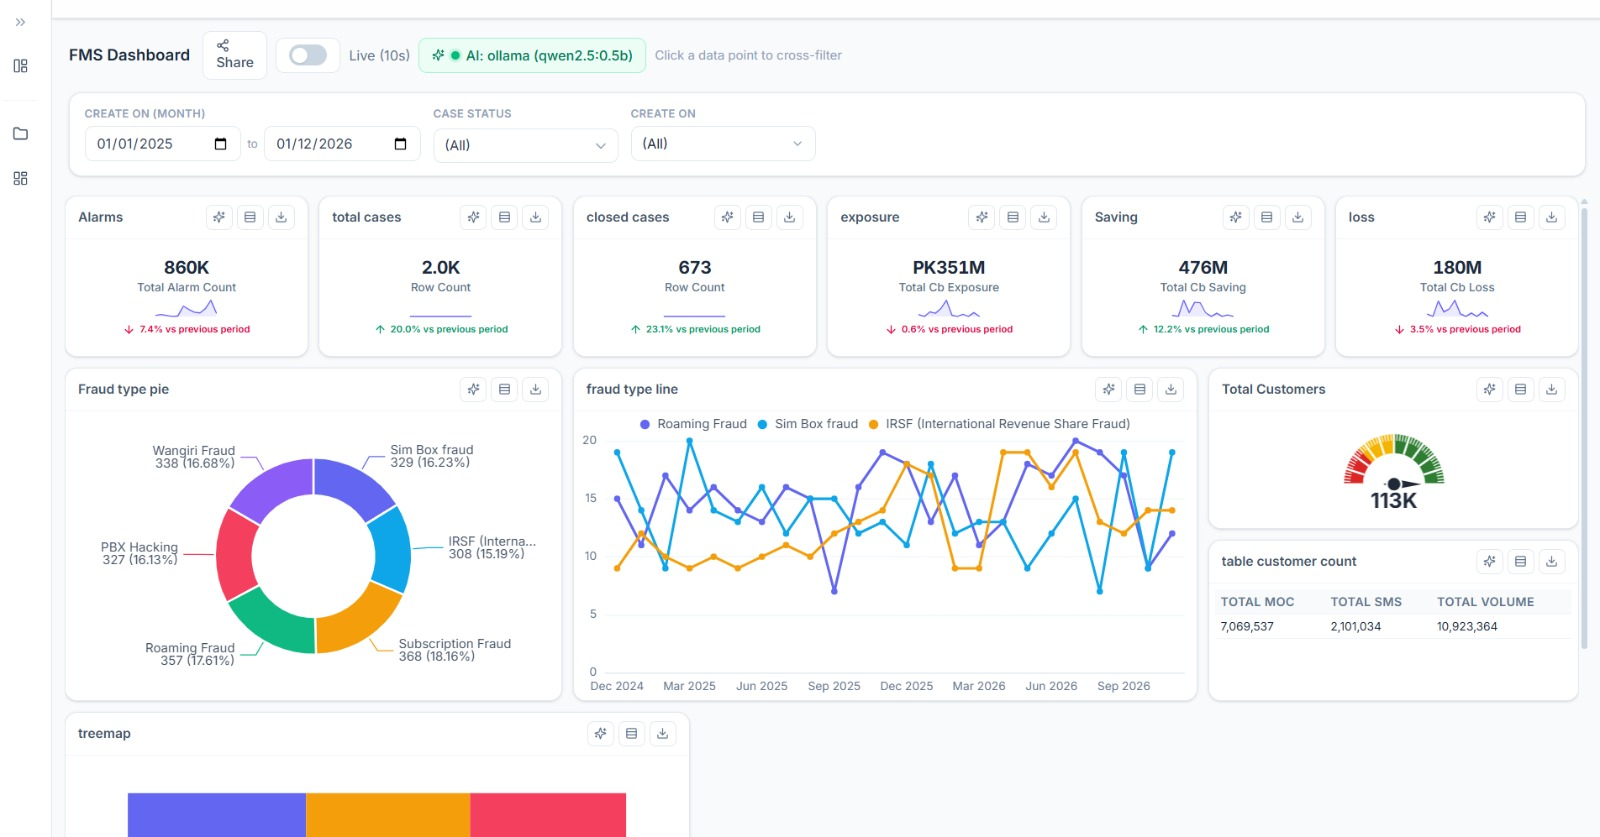
CuLyze is business intelligence software built to transform raw operational data into useful, understandable visual insights. It gives organizations a central workspace for creating dashboards, exploring performance, and communicating results across departments.
Instead of relying on disconnected spreadsheets or static reports, teams can connect live data sources and monitor the metrics that matter as conditions change. Interactive filters, visual comparisons, and drill-down analysis help users move beyond headline numbers and understand what is driving them.
CuLyze makes self-service analytics available to business users without removing the structure enterprises need. Leaders gain faster access to decision-ready information, analysts can build richer reporting experiences, and data teams can support more users through reusable dashboards and consistent metrics.
CuLyze brings data connectivity, visual dashboard design, and report delivery into one intuitive business intelligence platform.
Create polished, interactive dashboards in a visual workspace. Arrange charts, scorecards, tables, filters, and drill-down views without relying on code or lengthy development cycles.
Connect dashboards to operational databases, cloud platforms, APIs, warehouses, and business applications so teams can monitor current performance from a single analytics environment.
Combine related information from multiple systems into unified metrics and visualizations. CuLyze gives decision-makers a connected view of the business instead of isolated reports.
Turn dashboard findings into presentation-ready reports that can be shared with executives, clients, and operational teams for reviews, planning, and informed action.
Bring live and governed business data into one analytics workspace from the systems your teams already use.
Build visual analyses, apply filters, compare segments, and investigate changes through an intuitive no-code experience.
Share dashboards and export clear reports that help stakeholders understand performance and act with confidence.
Give people the context they need to spot changes, explain outcomes, and align decisions around reliable business data.
Move from a business question to a useful visualization quickly, without waiting for a custom report or a new development sprint.
Bring KPIs from disconnected systems together so leaders can evaluate operations, customers, revenue, and growth in context.
Give teams shared dashboards and reusable metrics that reduce spreadsheet duplication and keep conversations anchored in the same information.
Enable business users to explore approved data independently while technical teams focus on governance, quality, and strategic data work.
CuLyze supports strategic reporting and day-to-day analysis across teams, helping organizations connect high-level goals with operational performance.
CuLyze is an enterprise business intelligence and data visualization platform for creating interactive dashboards and reports from live business data without coding.
Yes. CuLyze is designed to connect and blend data from different business systems so teams can analyze related metrics together in a unified dashboard.
CuLyze supports executives, analysts, managers, and operational teams that need accessible self-service analytics, while helping data teams deliver governed information at scale.
Yes. Teams can turn visual analysis into exportable, stakeholder-ready reports for executive reviews, presentations, planning, and ongoing performance reporting.
Talk with CubeTech Solutions about using CuLyze to connect your data sources, modernize business reporting, and deliver interactive insights to every decision-maker.
Get in touch